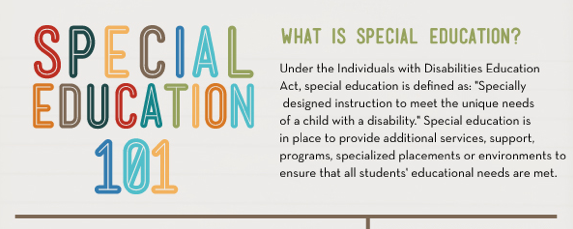
Here is a great info-graphic on Special Education in the United States. According to it’s information, Special Education is defined as “specifically designed instruction to meet unique needs of a child with a disability.” It also shows the variety of special needs including: specific learning disability, language/speech impairment, intellectual disability, emotional disturbance, hearing impairment, orthopedic impairment, other health impairment, visual impairment, multiple disabilities, deaf-blindness, autism, traumatic brain injury, and developmental delay. It illustrates how these are represented among those 13% in special education. It also examines the Individual Education Program, IEP, and the Committee for Special Education, CSE. This wording may change slightly across the US, but the same basic principle holds true. The IEP and CSE are there to individually support the child and make sure they truly reach their goals.
This info-graphic on Special Education, shows how the number of students enrolled in special education is growing, while those with specific learning disabilities is declining. These students needs are met in a variety of settings from main-stream (full-inclusion) to pull-out (inclusion) to self-contained. The important part of the IEP and CSE teams are to make sure that the child is in the right environment for them with minimal interference to mainstream as the goal. This is all defined as Least Restrictive Environment. According to this info-graphic, more than 50% of students with disabilities spend 80% of their time in a general education classroom. This is a number that has grown over the years as the idea and technics for mainstreaming have grown more popular. This not only keeps children with their peers but also helps cut costs. According to the U.S. k-12, the general education student ratio is 1:15.5 (something much higher in way too many regions of the US) while the average special education classroom is 1:7 (a ratio lower to meet the kids needs). The U.S. spends 16.5% or $11.5 billion on Special Education. At the bottom, the info-graphic talks about becoming a special education teacher. A job that is constantly needing more people to reach this special population.

Articles Related to ‘Special Education Infographic for the United States’
Special Education System: An Introduction
Qualifying for Special Education: What to Know
One thought on “Special Education Infographic for the United States”